EPR in Semiconductors

Spin-Hamiltonian parameter database for EPR centers in semiconductors

Help top | Policy | How to prepare *.inp file | Command lines | Author's comment lines | S and I | SH parameter matrices | Rotation matrices | Angular parameters | Transition tables | Parameter output(*.out file) | Graph output(*.plt file) | S=1/2 | S=1/2, I=1/2 | S=1

Graph output (*.plt text file)

“*.plt” text file contains graph data. There are two types of files depending on the type of simulation. The data are always tab-separated in the Database. When you execute a downloaded file in your own EPR-NMR, you can specify other data formats by changing PLOT option in command lines, for example,
PLOT=1 tab-separated,
PLOT=2 comma-separated,
PLOT=3 two binary files for Bruker-ESP series,
PLOT=4 binary data for Bruker WIN-EPR software,
PLOT=5 TELL-A-GRAF format.

Two examples shown here are obtained using the parameter file “G6.inp” (+1 divacancy in Si) in the Database.

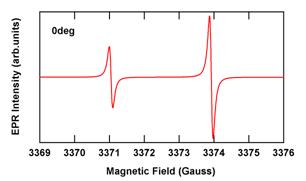
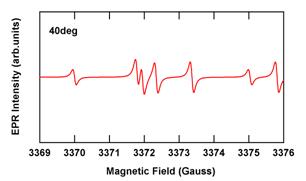
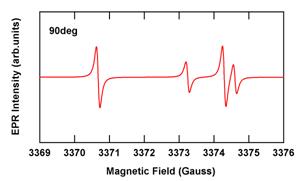
(1) Angular-Map simulation

G6 center in Si
(monoclinic-I system)
with 12 rotation matrices and
magnetic-field rotation in the (0-11) plane.
G6.plt
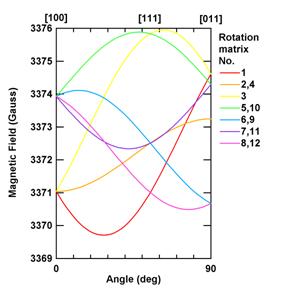
 0.000000    3371.039605    3371.039605    3371.039605    3371.039605  …
 2.000000    3370.865738    3371.042291    3371.222186    3371.042291  …
 4.000000    3370.701427    3371.050333    3371.412596    3371.050333  …
 6.000000    3370.547469    3371.063694    3371.609909    3371.063694  …
 8.000000    3370.404609    3371.082308    3371.813169    3371.082308  …
10.000000    3370.273539    3371.106085    3372.021388    3371.106085  …
12.000000    3370.154894    3371.134910    3372.233554    3371.134910  …
14.000000    3370.049246    3371.168641    3372.448635    3371.168641  …
16.000000    3369.957109    3371.207117    3372.665585    3371.207117  …
   …              …               …               …               …         …

      
        angles        simulated resonant fields (Gauss) or frequencies (MHz)
          (deg)           tabulated in order of transition tables
      

(2) EPR-spectrum simulation

Simulated EPR spectra of the G6 center for the magnetic-field rotation same as defined in (1). The y axes are equally scaled for these Graphs. The simulation automatically involves EPR-line-intensity calculation within the linear polarization theory.


G6.plt

   magnetic fields                        EPR intensities
    (Gauss)                                        (arb.units)

   3369.0000000000     .9555408277E+00
   3369.0068426197     .9667459238E+00
   3369.0136852395     .9781322704E+00
   3369.0205278592     .9897035844E+00
   3369.0273704790     .1001463675E+01
   3369.0342130987     .1013416446E+01
   3369.0410557185     .1025565899E+01
   3369.0478983382     .1037916135E+01
   3369.0547409580     .1050471360E+01
   …                                …
      
     Data length = 2048 points